R4
-Improved speed by ~450% by removing time hogging loops and replaceing them with cold hard math.
-Rearranged things
R3-1
-Cleaned up plotted equations a bit
R3
-Made the point plotter more efficent by reducing the ammount of times it looped.
-Fixed most problems having to do with lines breaking up.
-Sort of added custom polar graphing (use o for variable)
-Added some debugging stuff
-Now all points are actually plotted (stupid mistake I put a ">" instead of a ">=" ) So when you choose plot 20000 points will will plot 20000 points not like 18343 points.
R2
-Added a readme.
-Fixed the random number generator.
//--****--//\\\\\\\\\\\\\\\\\\\\\\\\\\\\\\\\\\\\\\\\\\\\\\\\//--****--//
Well I didn't want to litter the forum with pictures of the program so here are all the pictures I have created using the program to date:
The first pictures:
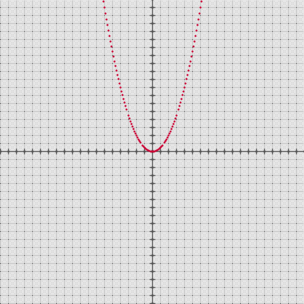
A parabola
Sort of fixed parabola
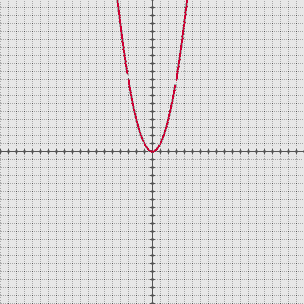
Fixed!
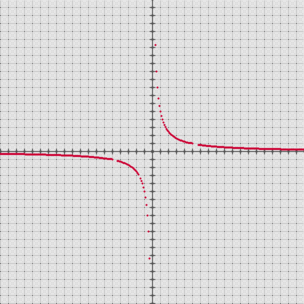
y=x^-1
random lines
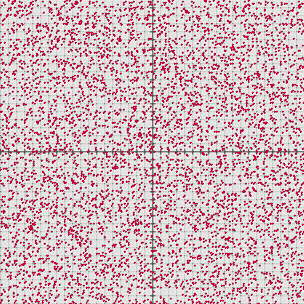
random dots
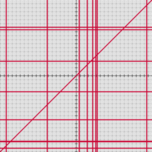
Polar Graphing (notice the change of background and dot color, someone said it looked like graph paper so I tried to make it look like graph paper even more)
Another color schem (I was bored)
The following Polar graphs are created by adjusting how often the expression is evaluated.
Last but not least, FRACTALS!
About the program...
The meat of the program, i.e. the way it graphs and figures out how to plot points where was all developed by me. However, I can not take credit for any of the text handling. A huge thanks goes to AbyssDragon for SET which I used in a modified form, (don't expect to be able to do everything that library let you do), and also to Deadron for his TextHandling library which I used also to evaluate expressions.
I decided not to make a hub entry for this yet, because it is not worthy of one. It is very early stage, and I am sure it is riddled with bugs. I released it through this site, because I have a lot of fun with it, and I hope you will also.
Known Issues:
Not all graphs are continuous.
Graphing equations is not perfect.
Everything else is not perfect
Please note this program can be very SLOW. So if you have a slow computer either be patient or don't let it plot to many points.
Some of the verbs may cause it to graph forever, clicking graph in the commands tab twice may stop this, if not exit and restart.
I am considering letting this be open source since some of it, (the test handling), is beyond my area of knowledge and I do not have much time to work on it, but right now the code is a bit of the mess, (the text handling), so I would want to clean it up first. Also I don't know if there is interest in this.
If you have any questions please ask, either here or in the forum, also if you have any ideas feel free to share them.
You can also e-mail me with questions, ideas, concerns or rants, at [email protected] please no flames though, if you want to complain at least give some valid reasons.
This program is the result of spending way to much time in math class programming on my calculator. People would see my using my calculator and assume I was playing games, (like any sane person does), however I was writing programs, and not just games, but also math programs. Somehow using a math utility to play games led to using a game utility to do math. (Good thing my teachers didn't know that I could practically program my calculator to do pretty much all the work for me, and show all the work, but hey I figure if you can figure out how to write a program to do something, then its not cheating, just being efficient since you had to know how to do it in the first place.)